The AAMC recurring Facts and Figures data series offers a wealth of statistical information on race, ethnicity, and gender patterns in U.S. medical education, as well as detailed data on the demographics and practice patterns of the physician workforce that graduated from U.S. MD-granting medical schools. We have provided selected snapshots from these reports that highlight current data on black or African American medical school applicants, students, graduates, and active physicians.
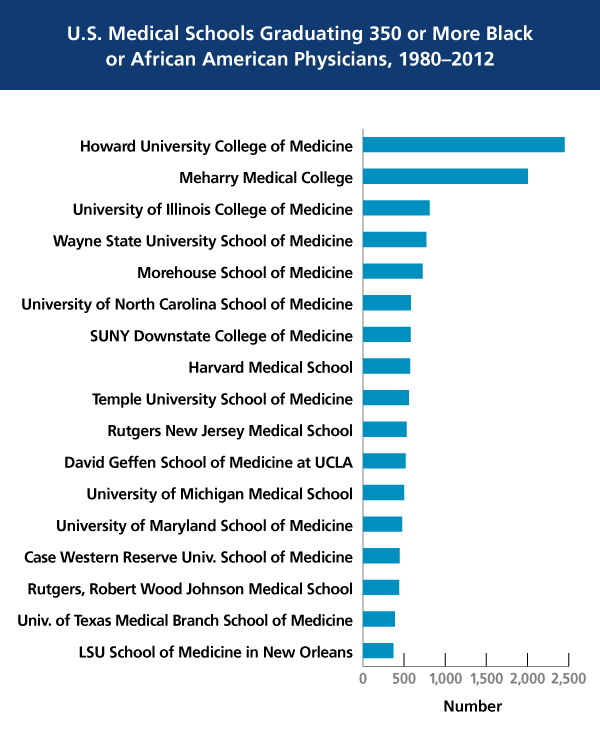
Among the U.S. medical schools that graduated 350 or more black or African American physicians between 1980 and 2012, Howard University and Meharry Medical College had the highest number of graduates, with 2,451 and 2,005 graduates, respectively.
 AAMC Data Warehouse: Minority Physician Database, AMA Masterfile, and other AAMC data sources, as of Jan. 22, 2014. Figure 11 in AAMC Diversity Facts and Figures
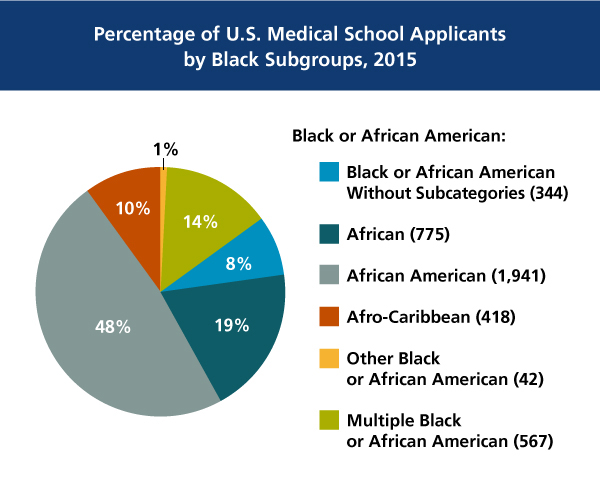
Most black medical school applicants identify with a subgroup within the broader black or African American race category. In 2015, those who identify as black or African American but did not specify a subgroup represent only 8% of black applicants. Among the rest who identify as a member of a subgroup: those who identify specifically as African American represent 47.5% of all black applicants; African applicants represent 19%; Afro-Caribbean applicants 10%; and applicants who identify with multiple black or African American subgroups composed almost 14% of all black applicants.

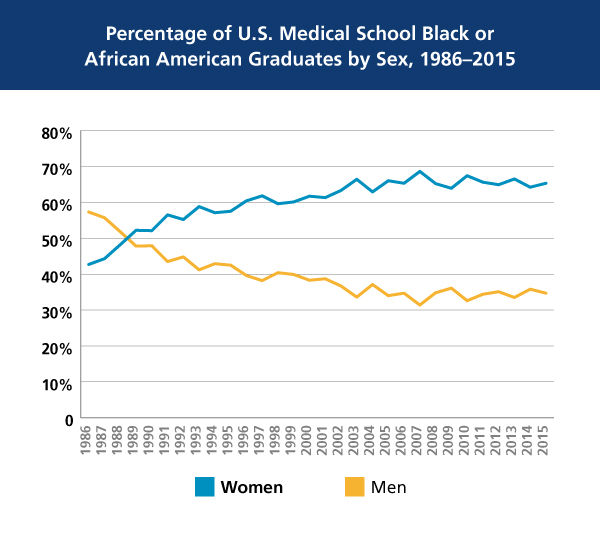
There is a well-documented trend of growth among black or African American female medical school graduates. Since 1986, the proportion of female graduates has increased 53%, and the proportion of male graduates has declined 39%. In 2015, the gender gap among black or African American graduates was 31%.

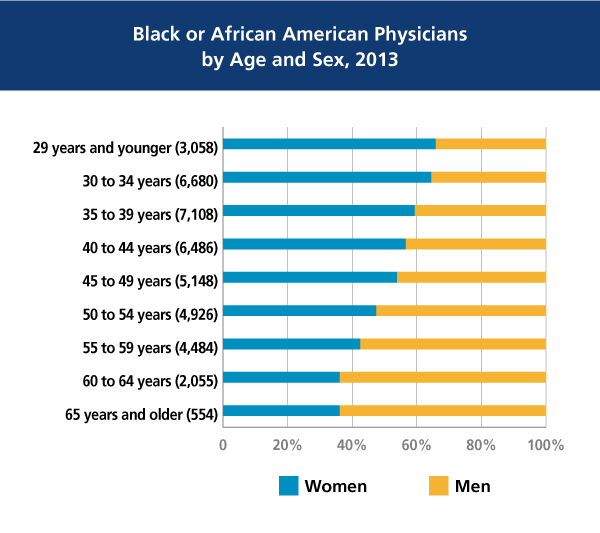
In 2013, black or African American male physicians made up a greater percentage of the workforce among older age groups than their female counterparts (age 50 and older). In contrast, among younger age groups (age 49 and younger), a greater percentage of the physician workforce was composed of black or African American women than men.

